What is market volatility?
Market volatility can present trading opportunities. But knowing how to navigate it is important if you want to take advantage of price swings while mitigating risk. Keep reading to explore volatile conditions, what drives them – and how to trade them.

Market volatility is the rate at which financial market prices fluctuate over time. High volatility means greater price swings, while low volatility indicates more stable movements. As a trader, volatile conditions may be appealing in their potential to capitalise on rapid price changes. But it's important to remember that these conditions also come with a higher risk of loss.
What causes sudden volatility spikes?
Several factors can cause volatility spikes, including:
- Economic data releases, such as inflation reports and employment numbers
- Central-bank decisions, like interest-rate changes
- Political events and geopolitical tensions
- Market sentiment shifts driven by news or unexpected events
- Liquidity fluctuations and institutional trading activity
How does volatility differ across underlying asset classes?
Volatility occurs for a variety of reasons across different asset classes. In the margin FX markets, currencies particularly react to central-bank policies, economic reports and geopolitical events. Meanwhile, share indices CFDs tend to experience volatility following earnings-report releases, macroeconomic trends, and political events. Commodity CFDs, however, fluctuate based on supply-demand dynamics, geopolitical risks and growth trends.
Implied vs historical volatility
Want to take advantage of volatile trading conditions? If so, it's important to consider the difference between historical and implied volatility. By doing so, you'll be able to better anticipate potential price movements, and refine your trade setups.
- Historical volatility is the measurement of past price fluctuations over a given period, essentially quantifying how much the price has deviated from its average. As a backward-looking indicator, it can be used to assess past risk.
- Implied volatility reflects the market's expectations for future price swings, which is often derived from options pricing. As a forward-looking metric, it helps to indicate the anticipated size of price changes.
What strategies work best for trading market volatility?
Volatile markets can enhance opportunities and risks, meaning that some strategies are more appropriate than others. Here are a few that you may consider:
Breakout trading
Breakout trading focuses on entering positions when prices move beyond established support or resistance levels. In volatile markets, these breakouts can happen rapidly, leading to strong directional moves. The key is to wait for confirmation rather than jumping in too early, as false breakouts are common during choppy conditions.

Mean reversion
This strategy is based on the idea that asset prices tend to revert to their historical average over time. When an asset's price moves significantly above or below its average (such as the 50-day or 200-day moving average), look for opportunities to trade back toward the mean. While effective in range-bound markets, this strategy can be risky in strong trending conditions, making proper risk management crucial.
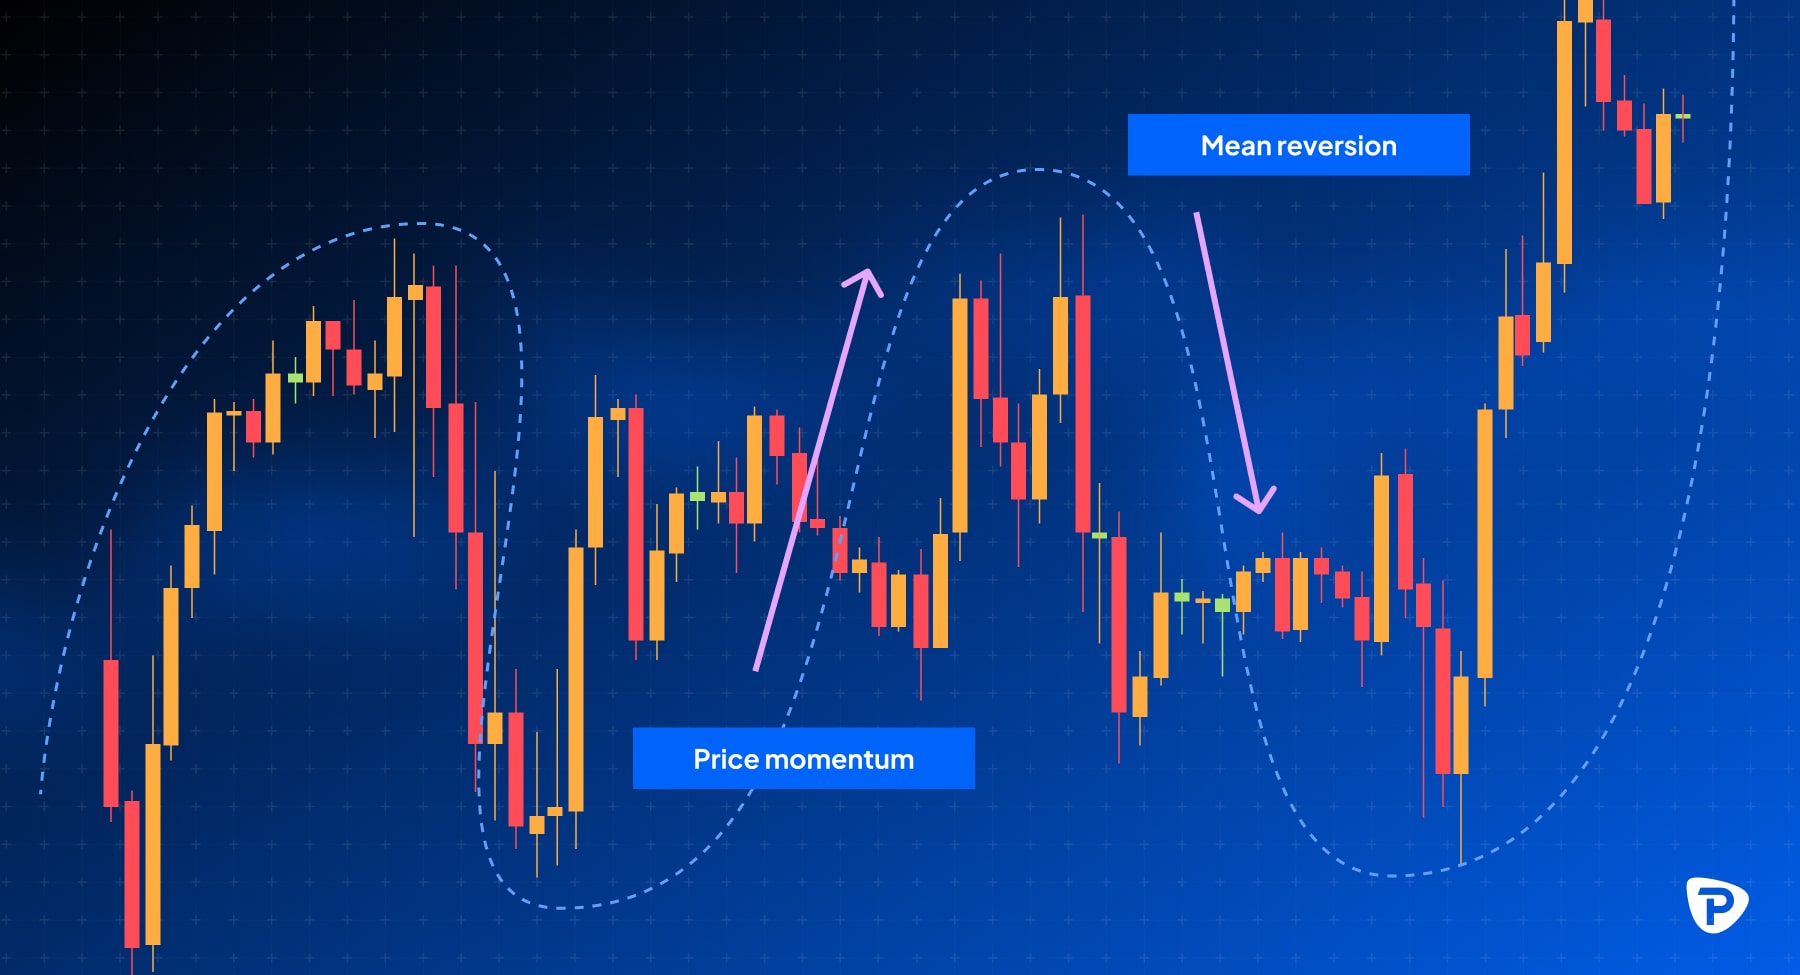
Momentum trading
Momentum trading aims to capitalise on strong price movements by following the direction of the trend. This strategy works well in highly volatile markets where prices can move aggressively in one direction. The key to success with momentum trading is to ride the trend while being ready to exit quickly if momentum fades or reverses.

Are certain underlying assets better for volatility trading?
Some underlying asset classes offer attractive opportunities to trade during choppy periods. Highly liquid margin FX pairs, such as EUR/USD and GBP/USD, major share indices CFDs, like the S&P 500 and Nasdaq – and commodity CFDs including oil and gold can all provide tradeable volatility.
You can also trade securities that are designed for speculation on volatility itself, no matter which direction the markets are moving. Options are contracts that give you the right – but not the obligation – to buy or sell an underlying asset at a certain price before a certain date. You can use to them to capitalise on rising, falling or even flat markets.
The VIX is an index which measures the expected movement in the S&P 500, and quotes it as an annualised standard deviation percentage. Its price is derived from the pricing of S&P 500 options, with expiries ranging between 23 and 37 days, and then weighted to create a rolling 30-day implied volatility. You can trade this via CFDs with Pepperstone, in the same way as any other index we offer.
Reacting to volatility following unexpected news events
Financial news events can trigger unexpected surges in volatility. To stay ahead of the curve, give yourself the best chance of success, and reduce your risk of loss, make sure to monitor economic calendars for scheduled announcements, use limit and stop orders to manage risk, and avoid overleveraging in uncertain conditions.
Using technical analysis patterns, indicators and tools to trade market volatility
Volatile markets require precision, so it's necessary to use technical analysis to help you identify key entry and exit points. Moreover, volatility indicators, chart patterns, and advanced trading tools are all also useful in improving your decision-making and reducing unnecessary risk when trading.
Using technical analysis patterns to spot high-probability trades
Price patterns can help you anticipate potential breakouts, reversals or trend continuations. Some key patterns include:
- Triangle patterns (ascending, descending and symmetrical): These indicate periods of consolidation before a breakout, making them useful for trading volatility spikes.
- Head and shoulders: A reversal pattern that signals potential trend changes, especially in volatile conditions.
- Engulfing candlestick patterns: Bullish or bearish engulfing candles often indicate strong momentum shifts, useful for timing entries.
- Volatility squeezes: A pattern where price movement contracts before an explosive breakout, often seen with Bollinger Bands or Keltner Channels.
Key volatility indicators
Some indicators are particularly useful for identifying and measuring volatility, which can help you adjust your strategy accordingly. Some of the most actionable include:
- Average True Range (ATR): Measures market volatility by calculating the average range between highs and lows over a set period. A rising ATR signals increasing volatility, which can help you set stop-loss levels more effectively.
- Bollinger Bands: These bands expand and contract based on price volatility. Widening bands signal high volatility, whereas when they contract, the markets are calmer. Breakouts from the bands can signal potential trade opportunities.
- Volatility Index (VIX): Known as the 'fear gauge,' the VIX measures expected volatility in the stock market. A high VIX often signals market uncertainty and, therefore, potential opportunities to trade.
- Keltner Channels: Similar to Bollinger Bands but based on ATR, these channels can help you spot breakout conditions and gauge trend strength.
How to mitigate risk when trading in volatile markets
Volatile markets can create both opportunities and significant risks. To navigate sharp price swings effectively, it's important to have a risk-management plan that involves managing your leverage, position sizing, stop-loss placement and overall risk exposure.
Adjusting leverage during extreme volatility
High leverage can amplify gains, but it can also increase potential losses. This makes it particularly risky during extreme market fluctuations. So, during periods of heightened volatility, consider:
- Reducing your position size to lower exposure to large price swings.
- Scaling into trades rather than committing full capital at once.
- Monitoring your margin levels closely to avoid forced liquidations.
Sizing positions to mitigate risk
Position sizing is a critical consideration in volatile conditions, to avoid unnecessary losses. Some traders prefer to risk a fixed percentage of their capital per trade, as this will ensure no single loss is too detrimental. Adjusting your position sizes based on volatility indicators – like ATR – can also be a smart way to minimise risk, by accounting for increased price fluctuations. Moreover, consider diversifying your trades across assets to avoid overexposure to a single volatile instrument.
Using stop-losses and trailing stops effectively
Stop-loss orders help protect against excessive losses, but they need to be placed strategically in volatile markets:
- Avoid placing stops too tight, as rapid price spikes could trigger premature exits.
- Think about using ATR-based stops to account for increased price swings.
- Consider trailing stops to lock in profits while allowing room for price movement.
Remember that stops can be subject to slippage when a market moves quickly or gaps. This means you might not be closed out at the exact price you requested.
Adjusting trading hours for high volatility
Different markets experience peak volatility at different times. For example, if you trade CFDs on margin FX you’ll often see volatility during major economic releases or market openings – especially London and New York. For stocks, however – the first and last hours of the trading session tend to be the most volatile.
Hedging positions to reduce exposure
Hedging can help offset potential losses during volatile conditions. Common hedging strategies include:
- Using correlated assets, such as long and short positions in different but related instruments.
- Diversification, spreading risk across multiple assets rather than concentrating on a single position.
Understanding liquidity risks in volatile markets
Highly volatile assets can suffer from liquidity issues, leading to difficulties in entering or exiting positions at desired prices. To mitigate liquidity risks:
- Trade assets with strong volume to ensure smoother execution.
- Avoid low-liquidity hours when spreads widen and price gaps are more common.
- Monitor order book depth to assess market conditions before placing large trades.
How to start trading market volatility with Pepperstone
Looking to capitalise on price swings? One way to do this is by trading CFDs, which enable you to take a position on margin FX, indices CFDs and more in either direction.
To get started, follow these steps:
- Open an account with our straightforward, four-step process.
- Perform research to ensure you understand the likely volatility and risks of the markets you’re interested in.
- Locate your chosen market in our platform or app, viewing its chart or our analysts’ research to better understand its price action.
- Open your position with suitable risk management in place.
How does Pepperstone’s platform support volatility trading?
Not all platforms are created equal. Pepperstone’s is perfect for trading during volatile conditions, thanks to its:
- Low-latency execution for faster order placement.
- Advanced risk management tools like stop-losses and trailing stop orders.
- Diverse asset offerings for volatility-focused traders.
FAQs
Can algorithmic trading help manage volatility?
Yes. Algorithmic trading can execute trades quickly based on pre-set criteria. This can reduce emotional decision-making during volatile conditions and help you protect your capital.
How do professional traders maintain emotional discipline?
What often sets pro traders apart is their ability to stay emotionally disciplined, even when confronted with unexpected price movements. They are known to do this by:
- Sticking to predefined trading plans.
- Using risk-management techniques.
- Keeping emotions in check by focusing on long-term strategy.
How do trading costs change in volatile markets?
During volatile periods, you may encounter higher trading costs, wider spreads due to lower liquidity, and increased slippage due to fast price movements.
The material provided here has not been prepared in accordance with legal requirements designed to promote the independence of investment research and as such is considered to be a marketing communication. Whilst it is not subject to any prohibition on dealing ahead of the dissemination of investment research we will not seek to take any advantage before providing it to our clients.
Pepperstone doesn’t represent that the material provided here is accurate, current or complete, and therefore shouldn’t be relied upon as such. The information, whether from a third party or not, isn’t to be considered as a recommendation; or an offer to buy or sell; or the solicitation of an offer to buy or sell any security, financial product or instrument; or to participate in any particular trading strategy. It does not take into account readers’ financial situation or investment objectives. We advise any readers of this content to seek their own advice. Without the approval of Pepperstone, reproduction or redistribution of this information isn’t permitted.